When Return Disposition Delays Age DTC Inventory
Most brands track the refund. Few track the days a returned unit sits idle at the 3PL, aging on the shelf while cash is already gone from the ledger.
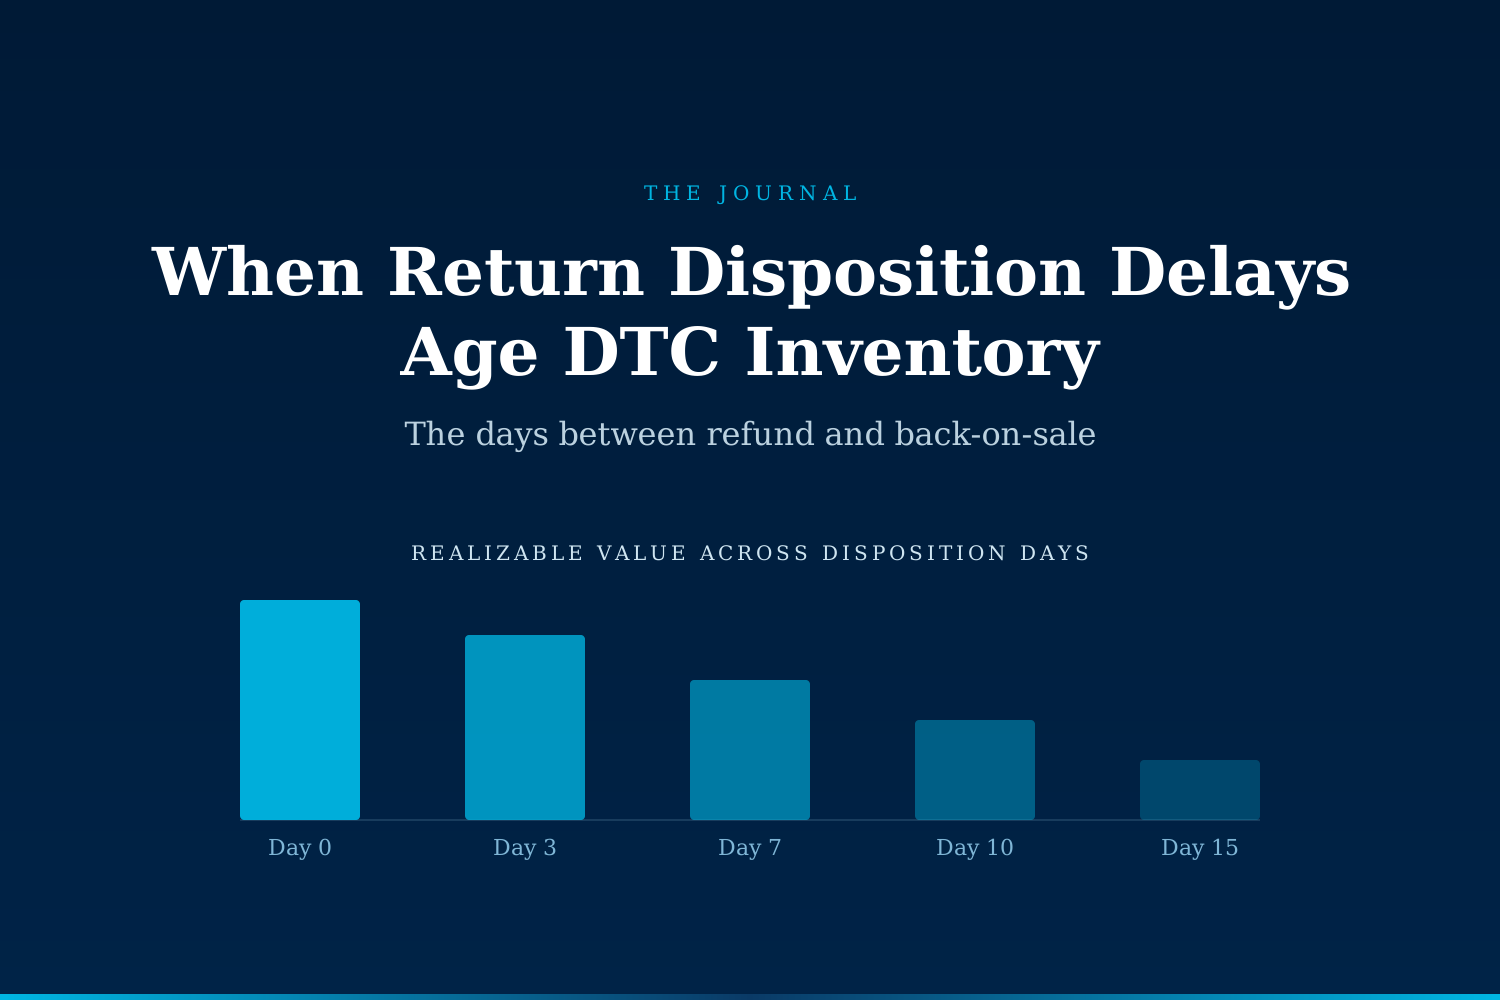
Most DTC brands treat return disposition as a warehouse task, not a margin lever. But returned inventory that waits five to fifteen days at the 3PL for grading loses shelf-clear velocity, seasonal value, and working capital. The time between return receipt and back-on-sale is where post-return margin erodes, largely unmeasured.
What is return disposition, and why does it lag?
Return disposition is the sequence that starts when a returned parcel arrives at the 3PL and ends when the item is either back on the sellable-inventory list or routed to an alternate path (outlet, liquidation, donation, vendor return, or disposal). It sits between the customer refund and the next revenue event on that unit, and its duration is rarely tracked as a standalone KPI.
The lag comes from four places most brands know exist and few measure end-to-end:
- Photo-grading requires a human decision on visual condition and stated reason code.
- Reason codes on the RMA rarely match the physical state of the item, so the grader re-inspects.
- Disposition rules (what condition equals restock vs. outlet vs. vendor return) live in a policy document, not the WMS, so exceptions escalate.
- Batch processing waits for cart-full or shift-end triggers rather than running item-by-item.
Industry data from the National Retail Federation put U.S. return rates at roughly 16.9% of retail sales in 2024, with online return rates higher still, and apparel or accessories-heavy DTC brands frequently reporting rates above 20%. Whatever a brand's return rate, the disposition cycle applies to every unit that comes back, and the cycle time compounds the cost per return.
What does the lag actually cost a DTC brand?
The cost lives in four buckets:
- Missed resale windows. Sellable-as-new items that arrive back mid-week don't reach the storefront's live inventory until the following Monday. During the intervening days, competing units in the pick location deplete first, and the returned unit lands at the back of the queue.
- Depreciation on time-sensitive SKUs. Seasonal apparel, holiday collections, and trend-driven items lose realizable value every day they sit un-graded. A jacket returned in mid-February that clears back to sellable in early March is priced against a very different demand curve than the one it left on.
- Working capital drag. The refund is issued at return receipt; the inventory is not sellable again for the length of the disposition cycle. That window ties up cash on both sides of the ledger simultaneously.
- Second-touch cost creep. Every day an item sits in the receiving lane increases the chance of a second touch (re-sort, re-scan, re-shelved from staging, incremental handling damage). Reverse-logistics studies from the Reverse Logistics Association have consistently found that multi-touch returns run several multiples the cost of single-touch ones.
The National Retail Federation and Appriss Retail have published joint estimates that reverse logistics can consume 20% to more than 30% of the original order value once processing, restocking, and disposition are added together. The disposition slice of that number is the one few brands isolate.
Manual disposition vs. AI-augmented disposition
The comparison is not "human out of the loop." It's human on the exceptions, machine on the routine.
| Dimension | Manual disposition | AI-augmented disposition |
|---|---|---|
| Grading pass on standard categories | Human inspects, photographs, decides | Image classifier grades; human confirms exceptions |
| Reason-code reconciliation | Read stated reason, inspect item, override | Model cross-checks stated reason vs. image, flags mismatches |
| Disposition path selection | Rules in policy doc, judgment call | Rules in system, applied at grade time |
| Median cycle time | 5 to 15 days at a mid-size 3PL | 24 to 72 hours across the standard SKU set |
| Restock-eligible items back on storefront | Batch, next inventory sync | Near-real time |
| Second-touch rate | High on unclear or borderline units | Lower; borderline units route straight to specialist |
| Volume ceiling | Rises with headcount | Rises with model throughput |
The AI side is not less accurate on borderline items. It is faster on the routine ones so the graders can spend real attention on the borderline ones.
Which SKU categories lose value fastest during disposition delay?
Not every category bleeds the same amount from a slow cycle. In DTC portfolios that mix apparel, accessories, home goods, and durables, the aging curve is uneven:
- Trend-driven apparel and footwear lose the most. Sell-through curves peak in the first two to three weeks of a launch, so any day out of stock during that window is unrecoverable.
- Seasonal SKUs (holiday collections, seasonal colorways) can lose double-digit percentages of realizable value across a ten-day disposition delay.
- Beauty and personal care face separate constraints (batch codes, tamper seals) that make disposition rules more binary but still time-sensitive on active promotions.
- Home and durable goods tolerate longer cycles for realizable value but tie up more cash per unit while they wait.
- Basics and evergreen SKUs lose the least. They're the reason a brand can tolerate a slow cycle at all: the median unit forgives the delay.
The trap is that basics forgive the delay and disguise the problem. A blended average makes the disposition cycle look acceptable even when the trend items in the same warehouse are hemorrhaging value.
What changes when disposition runs in near-real time?
The observable changes on a DTC ops dashboard, in the first quarter after moving from batch to near-real-time disposition, tend to cluster in four places:
- Return-to-sellable time drops sharply on the standard SKU set. Not every unit; the exceptions still take human time. The routine ones (the majority of volume in a typical apparel or accessories catalog) clear in hours rather than days.
- Restock alerts on returned inventory become a real channel again. Waitlist customers on out-of-stock SKUs get pinged from returned units, not just new production.
- Second-touch costs at the 3PL fall. Fewer units in staging means fewer re-sorts, fewer damage events, fewer disputed damage charges.
- Working capital cycle tightens by the disposition-delay length. Not dramatic per unit, meaningful in aggregate on a $10M-plus DTC brand with a 15%-plus return rate.
None of this requires a full 3PL replacement. Most modern WMS platforms accept an inbound decision feed; the friction is in producing a good disposition decision fast enough for it to matter.
When is return disposition lag worth prioritizing?
Not every DTC brand needs to move on this. The signals that push it up the priority list:
- Return rate above 15%, or apparel and footwear in the mix.
- Meaningful seasonal or launch-driven inventory that peaks fast.
- Restock alerts or waitlists that customers actually engage with.
- A 3PL relationship where disposition SLAs are vague or absent from the contract.
- Working capital that is a live constraint on the next inventory buy.
If two or more of those apply, the disposition cycle is likely costing more than it looks on the return-cost report.
What we won't try to give you in a blog post
We won't hand you a step-by-step recipe for building an in-house grading model or a WMS integration. Those decisions depend on your specific 3PL contract, your existing systems, your return volume mix, and whether the model needs to be shared across brands or built to your catalog alone. What we can do is help you diagnose whether it's a live problem for your brand and, if it is, what the cleanest first move would be.
The best way to know whether return disposition is a real drag on your P&L is to look at your own numbers with someone who has seen the pattern before. We run a completely free automation audit for DTC teams that want a second opinion on where the post-return margin is actually going. No commitment, no slide deck. → Book the audit
Sami Raza
Software Developer & Technical Author
Sami Raza builds AI automation for logistics, DTC, and construction operations teams at ApexifyLabs, and writes about the operational failures that automation is actually worth pointing at.