The Return-to-Exchange Conversion DTC Brands Rarely Measure
Most DTC returns default to refund the moment a customer opens the portal. The share redirected to an exchange is small, quietly measured, and where retained revenue lives.
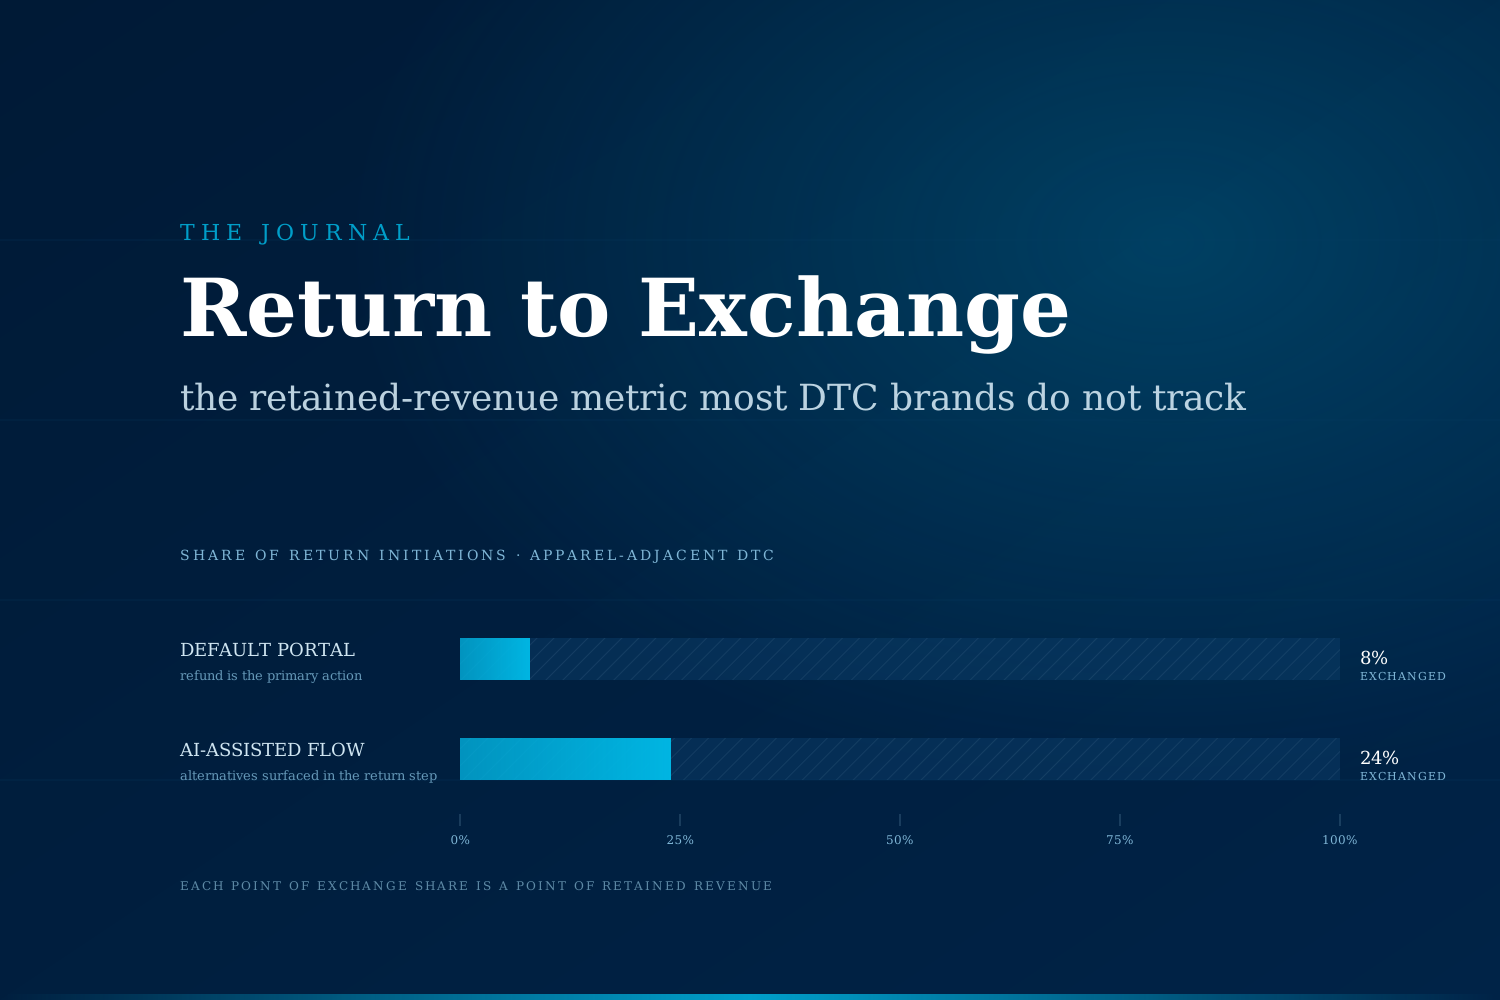
Return-to-exchange conversion is the share of DTC returns a brand's post-purchase flow redirects into an exchange for a different size, color, or product before a refund is issued. Most mid-size brands run below 15% by default. Few measure the number. On a $10M catalog, single-digit gains recover meaningful retained revenue each year.
What is return-to-exchange conversion?
Every return a DTC brand receives has two possible outcomes at the point of initiation. One is a refund, either to the original tender or as store credit. The other is an exchange, where the customer keeps the transaction and swaps into a different SKU, size, or color. The exchange path preserves revenue that would otherwise flow back out of the business, minus the cost of one additional shipment.
Return-to-exchange conversion is the ratio of the second outcome to total return initiations. It is not the same as store credit adoption. Store credit is a refund the brand pays out later. An exchange keeps the original purchase intact and processes a fulfillment swap.
Why does the exchange path get overlooked?
Return portals are usually built to close a support ticket, not to preserve revenue. The default flow prompts a return reason, then a refund method, then a printable label. Exchange, when offered, sits behind a secondary click, and the customer has to specify the replacement SKU themselves. On a return driven by "size too small," this friction is enough that most shoppers take the refund and buy the correct size in a fresh cart, if they come back at all.
Three structural reasons the metric stays low across most DTC brands:
- Default UX. The portal treats refund as the primary action and exchange as an alternative branch. The copy, the button hierarchy, and the confirmation flow all reinforce this. Behavioral economics research consistently shows default options carry decisive weight even when the alternative is objectively better for the user.
- No SKU intelligence at the point of decision. The portal rarely tells the returning customer which alternatives are in stock, in their size, and in a color they might prefer. Without that surface, "exchange" is a blank field the customer does not want to fill.
- No metric owner. Return volume is tracked by customer service. Refund cost is tracked by finance. Exchange conversion sits between the two and typically has no dashboard, no target, and no weekly review.
The result is a return flow that operates as a one-way refund channel with an exchange option that almost no one uses. Industry commentary in Shopify's post-purchase reports, Loop Returns' benchmarks, and Narvar's annual State of Returns consistently places default exchange share in the low single digits to low teens for brands without a dedicated post-purchase optimization layer.
What is the revenue difference on a real catalog?
Directional math on a $10M annual DTC brand, apparel adjacent, industry-average return rates:
| Metric | Baseline flow | Exchange-optimized flow |
|---|---|---|
| Annual revenue | $10.0M | $10.0M |
| Return rate | 22% of orders | 22% of orders |
| Return volume | $2.2M initiated | $2.2M initiated |
| Return-to-exchange rate | 8% | 24% |
| Revenue retained through exchange | $176K | $528K |
| Net additional retained revenue | Baseline | +$352K |
| Incremental fulfillment cost on exchanges | Baseline | ~$25K to $40K |
| Net retained margin at 55% GM | Baseline | +$170K to $180K |
Return rates cited generically here match ranges reported by the National Retail Federation's annual returns study (roughly 17% to 24% for apparel-heavy DTC), and the exchange-conversion baseline and lift ranges match public benchmarks published by post-purchase vendors. The exact number varies by category. The direction and order of magnitude do not.
At $10M, a low-double-digit lift in exchange conversion recovers a mid-six-figure retained-margin line. At $30M, the same lever recovers seven figures. The recovered revenue does not require paid acquisition, does not compress margin, and does not lengthen payback periods.
Manual returns flow vs AI-assisted exchange flow
The mechanical difference between a default portal and one that actively steers toward an exchange:
| Step | Default returns portal | AI-assisted exchange flow |
|---|---|---|
| Return reason capture | Free text or fixed dropdown | Structured, tied to product attributes (size, fit, color) |
| Alternative surface | None or hidden behind a click | In-flow, ranked by inventory availability and match to reason |
| Personalization | None | Uses purchase history, sizing signals, and current stock |
| Confirmation experience | Refund confirmed, ticket closed | Exchange confirmed, replacement dispatched, label included |
| Data captured for merchandising | Return reason, refund amount | Reason, alternative shown, alternative chosen, mismatch signals |
| Weekly reporting | Return volume, refund dollars | Return volume, exchange share, revenue retained, product-level mismatch trends |
The difference is not a single feature. It is the shift from treating returns as a support workflow to treating them as a merchandising surface. The same return, the same shipping label, and the same reverse-logistics cost. A different first screen for the customer.
What most operators miss when pricing this
Three costs tend to land in the wrong place on the P&L when exchange conversion is low:
- Acquisition cost paid twice. A refunded customer who buys the correct size in a fresh cart still costs the brand a paid impression or an organic slot. Exchange conversion keeps the original acquisition attributable.
- Discount code re-application. Refunds usually void the promo used on the original order. Customers who repurchase often expect a code, so the second cart lands at the same or a lower AOV than the first. Exchange preserves the original economics.
- Reverse-logistics leverage. The fixed cost of a return label is nearly identical whether the outcome is a refund or an exchange. Every exchange spreads that cost across a retained order instead of a lost one.
None of these show up as a distinct line in a returns report. They show up as slightly higher CAC-to-LTV drift, softer repeat-order economics, and a returns-cost line that reads as unavoidable.
What changes when exchange conversion becomes a measured metric
Two shifts follow when a brand starts reporting exchange share weekly.
The first is faster merchandising signal. When the exchange flow captures the reason a customer swapped from a small to a medium, and the size mismatch is aggregated across the category, the merchandising team gets a size-curve or fit-callout signal weeks earlier than a customer service ticket queue would surface. A brand that catches a run of size-too-small on a new drop in week two can adjust the PDP fit note before the next inventory batch ships.
The second is retained-revenue discipline. Once the number is on a dashboard, ownership follows. Marketing, merchandising, and customer service each have a lever, and the weekly conversation becomes about what moves the rate rather than what defends the refund line. Brands that get here usually see steady climb from single-digit conversion into the mid-twenties within a quarter or two.
We describe the outcome shape here, not the workflow. The behind-the-scenes stack (reason parsing, inventory-aware alternative ranking, exchange fulfillment routing, and the merchandising loop that catches the pattern before the next drop) is where the operator-level automation earns its budget.
Three signals worth checking on your own store
If you run a $2M to $30M DTC brand and are not sure whether this metric is leaking:
- Current exchange share. Pull the last 90 days of return initiations. Divide exchanges by total returns. If the number is below 15%, the flow is running on defaults.
- In-portal alternative surface. Open your own return portal as a customer. Count the clicks between "start return" and "see alternatives in my size." If it is more than one, the exchange path is functionally hidden.
- Return reason granularity. If your top return reason is "other" or "did not fit," the flow is not capturing the resolution signal. That is a merchandising loss on top of the retained-revenue loss.
None of these require new tooling to run. They require sitting down with the returns portal and the return-reason report for one afternoon.
Closing
Return-to-exchange conversion is the kind of metric that does not show up in a monthly review because it lives between customer service and finance. The revenue it moves is real, and on a mid-size DTC catalog the numbers land in the six figures without touching acquisition spend or promotion cadence.
If your team has not measured this rate this quarter, an hour with the returns log and the portal will tell you where the flow is defaulting.
We run a completely free automation audit for DTC operators that want a second read on where the returns flow is quietly refunding revenue that could have been retained. No slide deck, no sales pitch, just the numbers on your own portal. → Book yours
Sami Raza
Software Developer & Technical Author
Sami Raza builds AI automation for logistics, DTC, and construction operations teams at ApexifyLabs, and writes about the operational failures that automation is actually worth pointing at.